
I have used the most recent Lucid Talk poll for my projection of party shares in the constituency.
In Upper Bann, both unionist and nationalist shares have bobbed gently up and down by small amounts for most of the decade. Unionists have been on a bit of a downward slope since 2017, but two elections in the same year do not make a long-term trend. Nationalists, too, dropped at the last Westminster election, but only to a level they had hit previously in the 2015 Westminster election and the 2016 Assembly election.
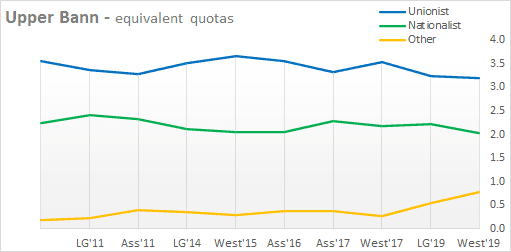
Yet the increase in others, although very recent, is too steep to ignore. It is hard to imagine reasons to vote tactically for an Other at a Westminster election in this constituency.
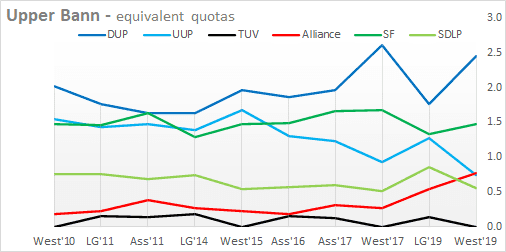
The DUP always gains a tactical boost from the TUV standing aside in Westminster elections here. And in the last two, UUP voters have donated very generously to the DUP. But the UUP never fell so far as it did in December 2019, dropping a couple of hundred votes below Alliance.
Although a small part of the Alliance increase between the Local Government elections and Westminster may have come from the UUP, much of it appears to have come from nationalists, and the SDLP in particular.
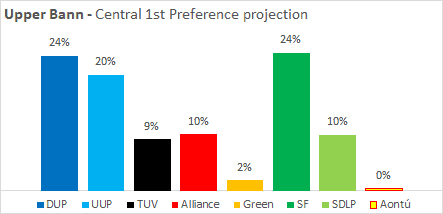
My Central projection of the Lucid Talk poll suggests a pattern like that below.
Which would mean that quotas per candidate might look something like this. Seats won in 2017 are highlighted in gold.
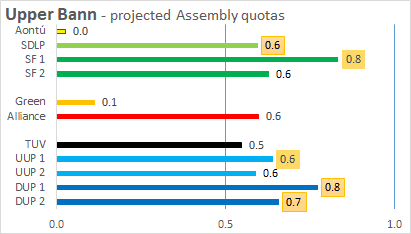
Each party’s votes are shown divided between their candidates in the same proportions as at the last election. It must be questionable whether the UUP could manage their vote as efficiently this time, with Doug Beattie likely to attract more due to his media exposure as leader. The party could attempt to compensate for this, but may hesitate to do so given the risks of over-compensation; if there were only 1 UUP elected it could accidentally be Beattie’s running mate.
All three projections agree that there would be three Safe seats, 1 DUP, 1 UUP and 1 SF.
The Central projection gives the DUP a second Safe seat. At that point the SDLP and the second SF could be close together, one of whom would face elimination. If the second SF goes, the SDLP is elected. If the SDLP goes, Alliance takes that last seat.
One of the other projections shows 4 Safe seats, 1 DUP, 1 UUP, 1 SF and 1 SDLP. The last seat would be either the UUP or the second DUP, both with equal Good chances.
The other also has 4 Safe, but is made up of 1 DUP. 1 UUP, 1 SF and 1 Alliance. The last seat would be between the second DUP and the TUV, with both having an equal chance.
In Upper Bann there appear to be few easy transfers to be had (those which permit a candidate to gradually build a commanding lead). Here it is more of a game of sudden death play-offs.
NOTE ON METHOD:
There is no perfect way to translate a national poll to a local constituency level. Still less so in a PR system. We must recognise a level of uncertainty. I have used the last Lucid Talk poll as my base for party shares, and information from the previous poll which tracked how voters for each party at the last Assembly election intend to vote this time. This allowed me to make two projections for each constituency, one based on vote switching since 2017, the other on changes in party vote shares since the 2019 Local Government elections. (I used the LG elections due to widespread tactical voting at the later Westminster.) To be clear both of these projections give the party shares shown in the latest poll.
The two different projections mimic two different patterns of changes in party support. In one, a party that is growing strongly will see a bit less of that growth where it is already strong, and a bit more where it was previously at it most weak. Conversely the parties that have lost voters will suffer a bit more in their strongest constituencies.
The other projection has the opposite effect. Either may prove to be a more accurate reflection of reality. And while the differences between the two are not massive (they both must total to the same poll shares across all constituencies) they can still sometimes produce different outcomes.
I should stress that while the Lucid Talk bears the responsibility for the original poll, the projections are entirely my responsibility.
For each 1st preference projection, I have used recent transfer patterns to identify all candidates who have any chance of winning on a scale ranging from Safe to Long Shot.
To avoid burdening you with all this detail I have averaged the results of the two projections and shown them as a Central projection, merely noting where one of the other projections produces a noteworthy difference.
Where a party is running more than one candidate, I have generally split the party vote between them in the same proportions at the last election. I have had to make my own assumptions when a party has a different number of candidates this time.
Michael Hehir is a retired sales and marketing manager. He studied in Northern Ireland but now lives between England and Italy.
Discover more from Slugger O'Toole
Subscribe to get the latest posts to your email.